
An experience map shows the journey a customer has while experiencing a product or service. It also shows what competitors and your business are doing relative to this journey.
Mapping the experience from a customer perspective helps organisations identify strategic opportunities, customer pain-points and generate innovative projects.
Why build an experience map?
An Experience map helps the organisation to see the bigger picture, and make decisions about where to focus activity based on research. By seeing the bigger picture, you’re able to:
- Identify projects and build a road map of work
- Identify opportunities for innovation
- Understand where the user experience is currently being well supported
Carrying out the research

A typical question in user research
- Ethnographic research
- In-depth interviews
- Guerilla research
The way you run the research can influence the quality of data you collect. I’m not going to cover user research methodologies as that is a whole different topic. If you want to read more about how to conduct user research I recommend reading Interviewing Users by Steve Portigal.
In a perfect world, you should transcribe all audio recordings of interviews for analysis. Analysing this amount of data can take weeks depending on the amount of research carried out. This isn’t ideal in a world where budget constraints and being first to market are important.
An alternative approach is having two people conduct the interviews. Have one person in charge of interviewing while the other types detailed notes. You can then use these notes for analysis.
"The way you run the research can influence the quality of data you collect."
Analysing the research
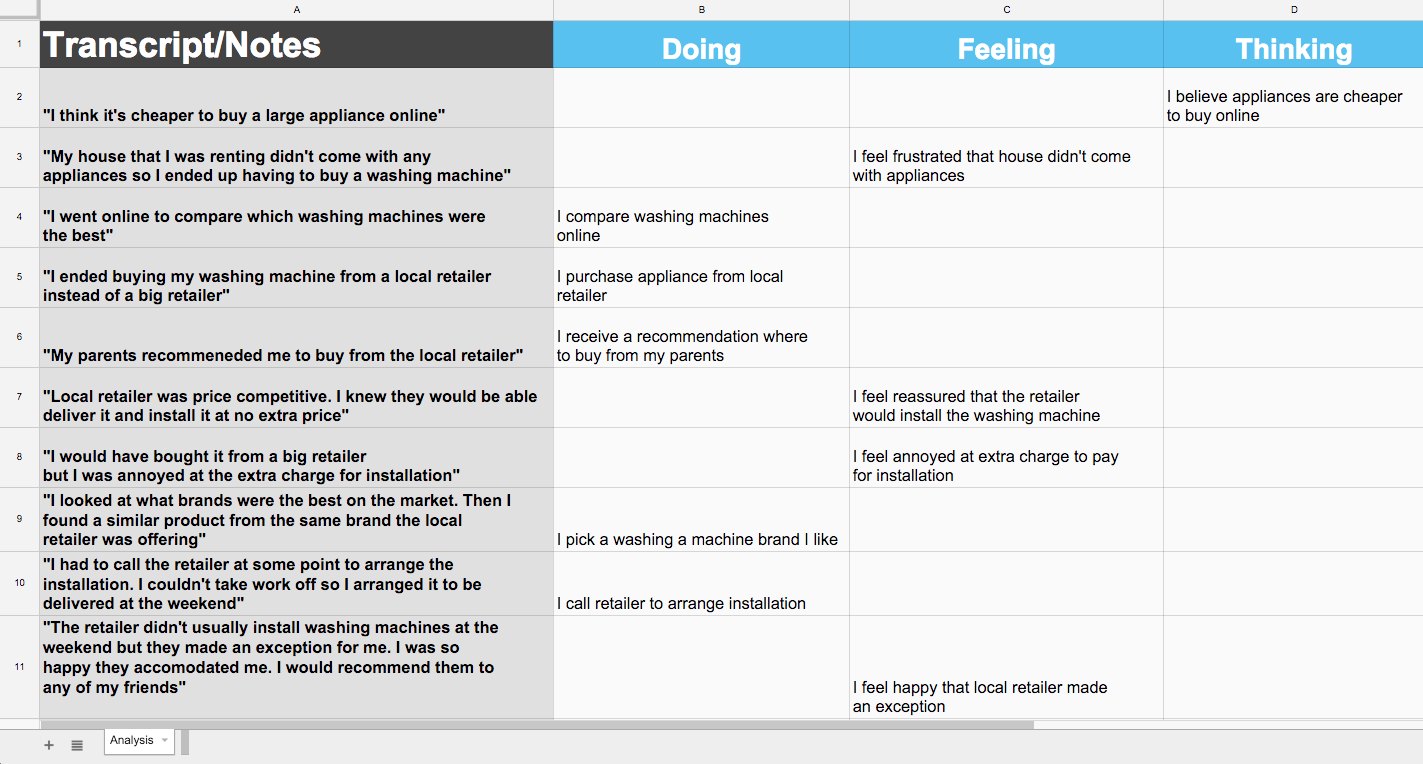
Next, open up an excel document or google sheet. Comb through the notes and extract what people are doing, feeling and thinking.
It’s important to phrase these extractions in a structured manner, from the users’ point of view.
Doing: I “Verb” … Example: I complain about item
Feeling: I feel … Example: I feel angry at broken item
Thinking: I believe … Example: I believe the quality of the item is poor
-

- Example notes + analysis of someone buying a washing machine
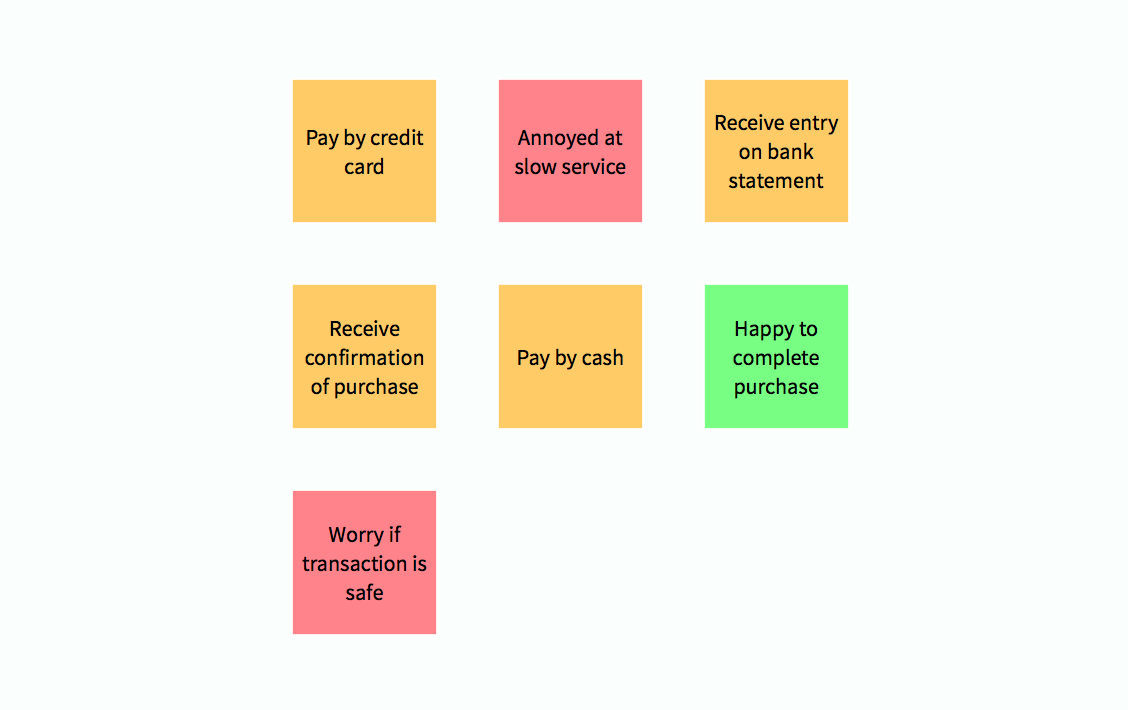
Once you finish the analysis, write all the behaviours and feelings on post-its. Remove the “I” in what people are doing and “I feel” in feelings to help make the map less cluttered and more legible.
Grouping the behaviours and feelings
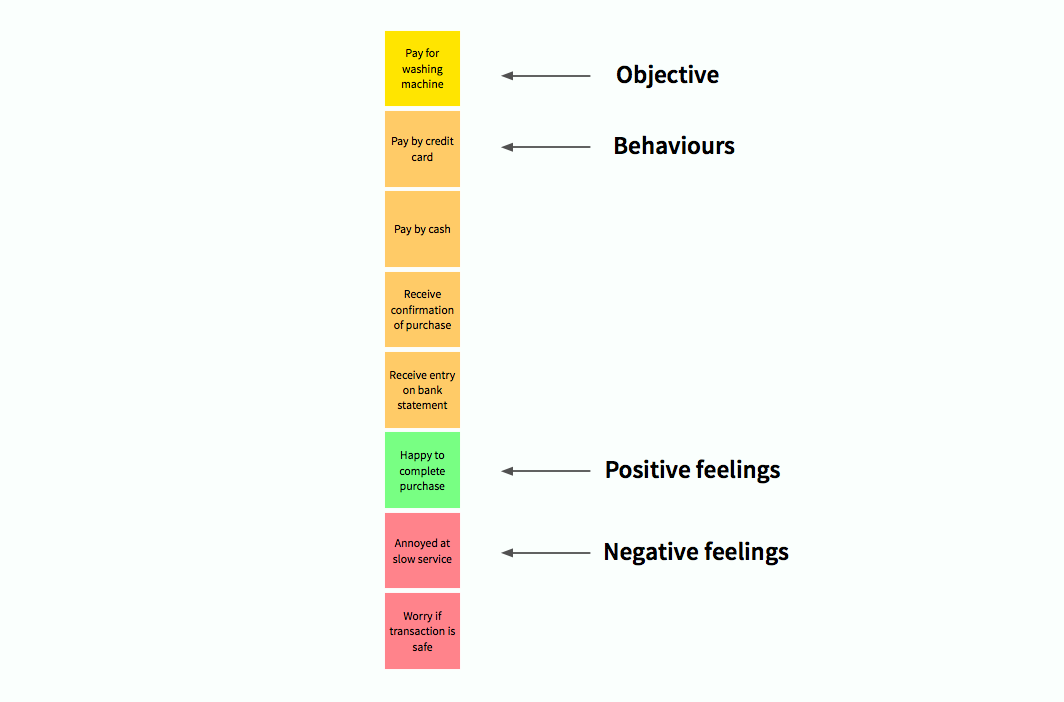
Group what people are doing (behaviours) and feeling based on customers objectives. Depending on the product or service you might have 40–80 objectives. An example of an objective might be when people “Pay for an item”.
-

- What people are doing and feeling when they pay for an item
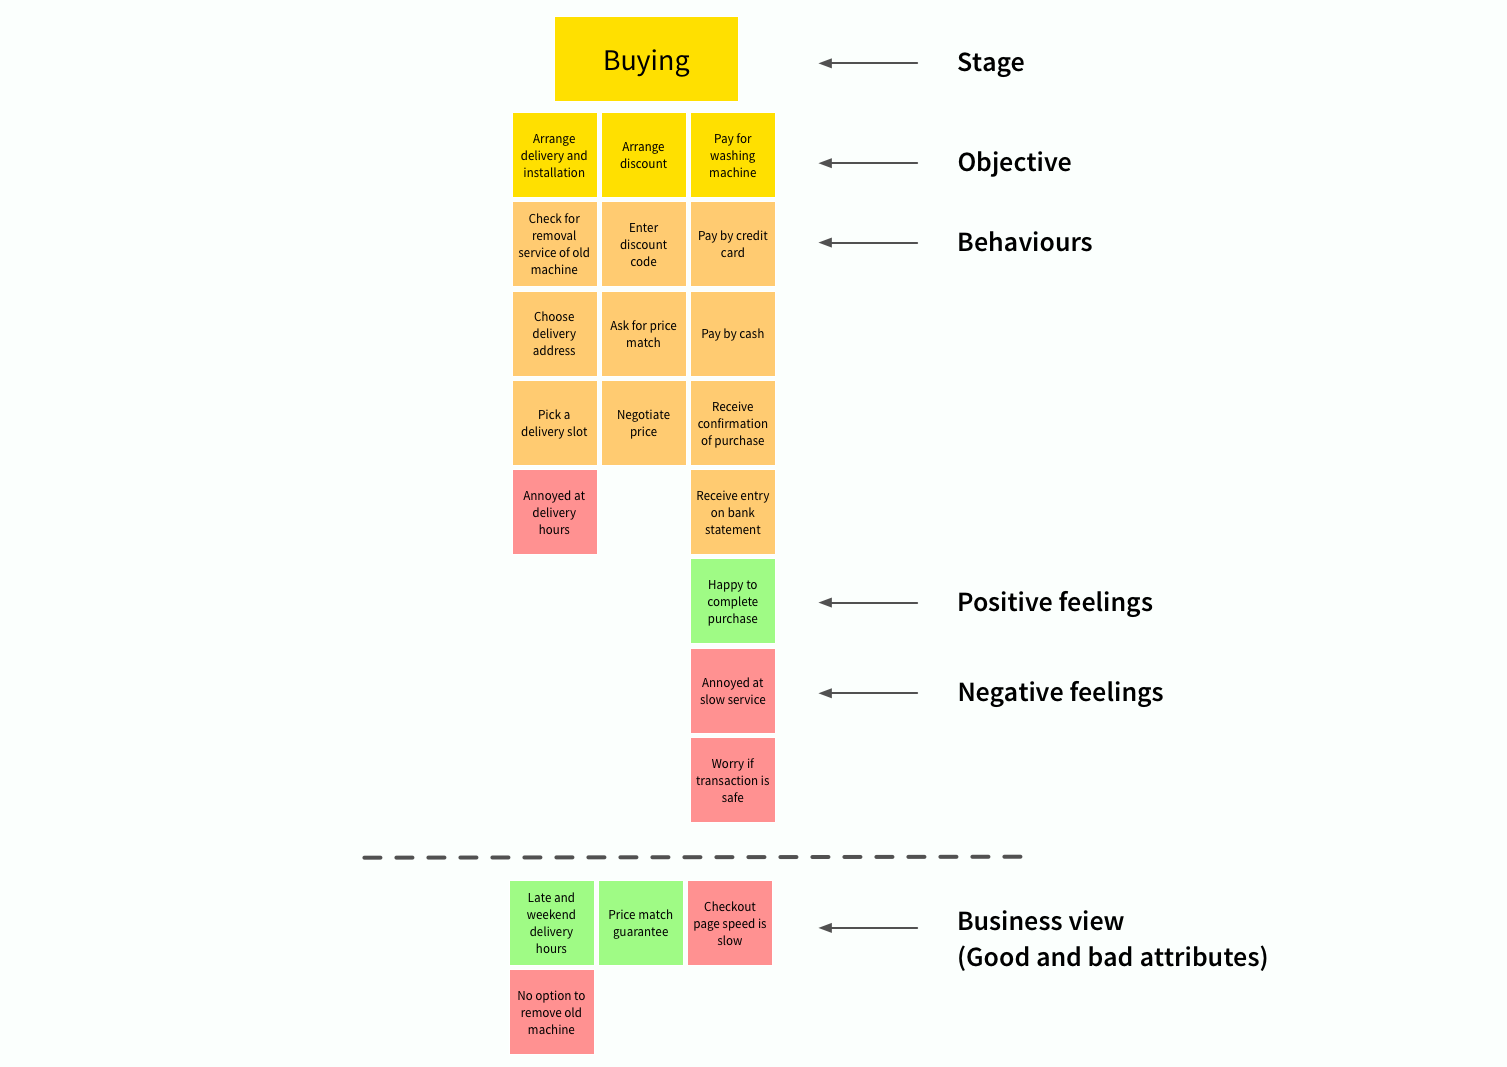
Prioritising the behaviours and feelings
Sitting underneath the objectives should be what people are doing (behaviours), positive feelings and negative feelings.
Prioritise individual behaviours and feelings on the order that best fits the objective, or the most frequently identified comments in your notes.
Ordering objectives
No one customer will demonstrate all behaviours you identify while experiencing a product or service. The map represents all behaviours, feelings and thoughts by all customers. Also not all people do these objectives in any given order.
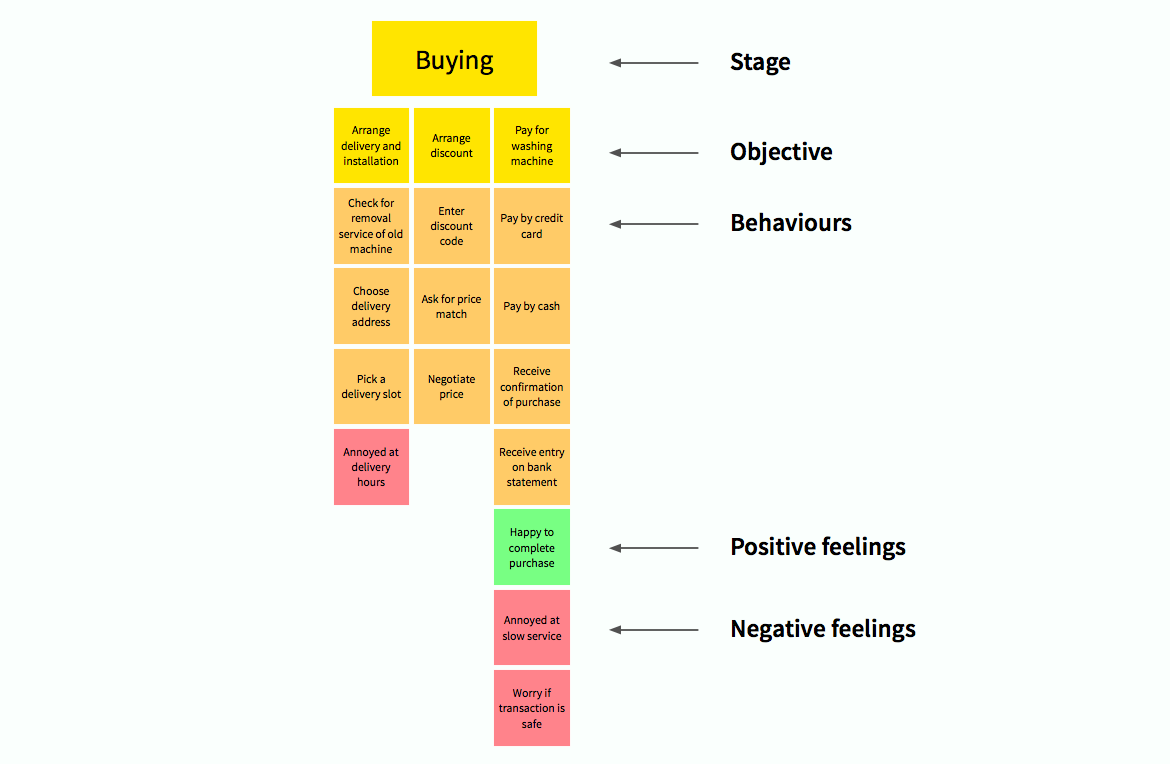
It’s up to you to make a judgement on the order of these objectives based on the research. Once you have ordered the objectives break them into groups or stages of an experience.
Name the stages using a verb in the present continuous (i.e. verb + “ing”) to capture behaviours that happen over a period of time.
Examples of stages: Choosing, Buying etc
"No one customer will demonstrate all behaviours you identify while experiencing a product or service."
Mapping the business
Getting a representative from each part of the business in a room will help you capture attributes of the product that are supporting or failing to support user behaviours.
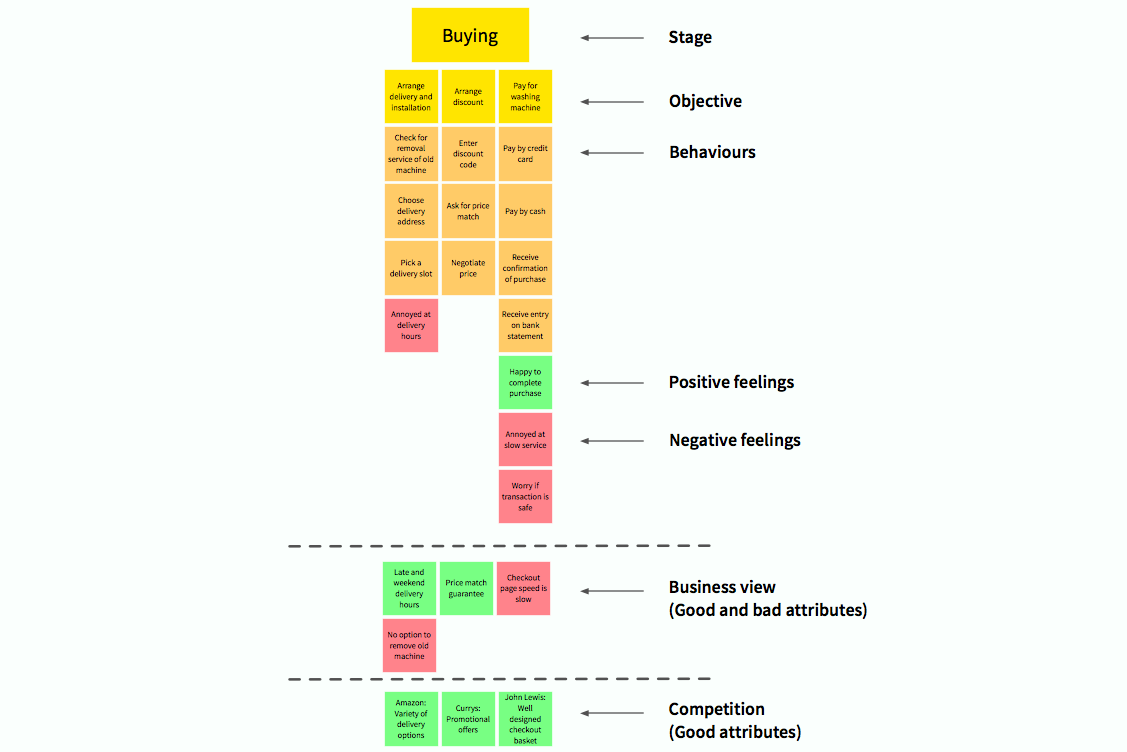
-

- Good and bad attributes of the business in relation to the map
Mapping the competition
Capturing what your competitors are doing well across the whole experience is not easy. The best way to achieve this is carrying out a longitudinal study.
A longitudinal study is an observational research method in which data and observations are gathered from a number of participants over a period of time.
Diary studies are my favoured form of longitudinal research. They can last a course of weeks or months. This study will capture interactions that may be invisible to your organisation — for example contacting competitors for a price.
In this scenario we’re looking for a series of delightful moments when interacting with a product or service to build out where competitors are doing well. The most convenient way of collecting these moments is by getting participants to use a mobile app. One app that is worthwhile having a look at is nativeye.
An alternative to a diary study is carrying out competitor analysis through desk research. It will however, produce significantly fewer insights of what your competitors are offering to their customers.
Adding the beliefs
Now it’s time to add what customers believe about your product or service.
Extract what customers are thinking from your analysis and sort similar “thinking” post-its into groups. Name each group with a label that represents all the post-its. These post-its will represent the beliefs people have about the product or service.
These beliefs should sit outside the map for two reasons. Mixing behaviours, feelings and thoughts disrupts the flow of the map. Also people’s thoughts are what they philosophically think about a product — not how they use it.

Presenting the map to the business
Once the map is complete, run a workshop with product owners to brainstorm ideas for the road map. Present back the map going through each of the phases including the competitor/business view.
It’s easy to forget that business decisions affect real people. When you present back your map to people within your company you must tell the stories that you heard in the user research.
Communicating stories back to stakeholders will increase the organisation’s empathy towards customers and help them make better decisions in the future.
"It’s easy to forget that business decisions affect real people."
Identifying opportunities
Gaps will open up showing where the product or service is not meeting the behaviours of customers. Strategic projects will also become visible by taking into account the competition.

Creating a roadmap of work
No matter how much evidence you put in front of an organisation, when it comes to making a roadmap, you should expect other factors to come into play. An experience map is not a solution for internal politics but it does give you the ability to draw on evidence from customers as you work through priorities.
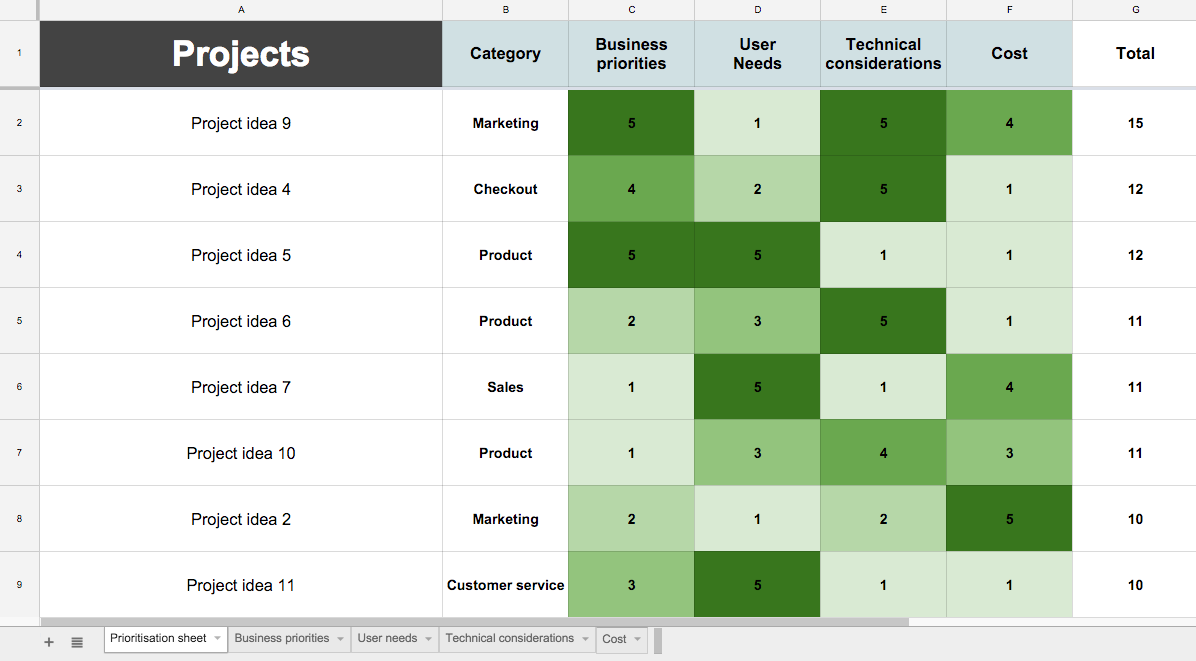
The first step in creating a road map is prioritising your list of ideas. I recommend using a set of criteria to help you prioritise potential projects. You can give each project a score based on the set of criteria.
Scoring potential projects is a subjective process but using domain experts and any data available will help.
Example criteria: Technical considerations
Domain expert to set score: Development lead
Use separate tabs to add in commentary from the domain expert to give rationale for each score. Any decision maker that questions a score will then be able to investigate further.
Prioritising projects isn’t as easy as just giving each one a score. Each initiative is likely to have its own dependencies and constraints. Therefore sometimes it will be more efficient to group some pieces of work together.
At the end of the day when you have a prioritised list of projects you need to make a plan based on what is practical.
Template Experience Map
-

- Basic template of an experience map
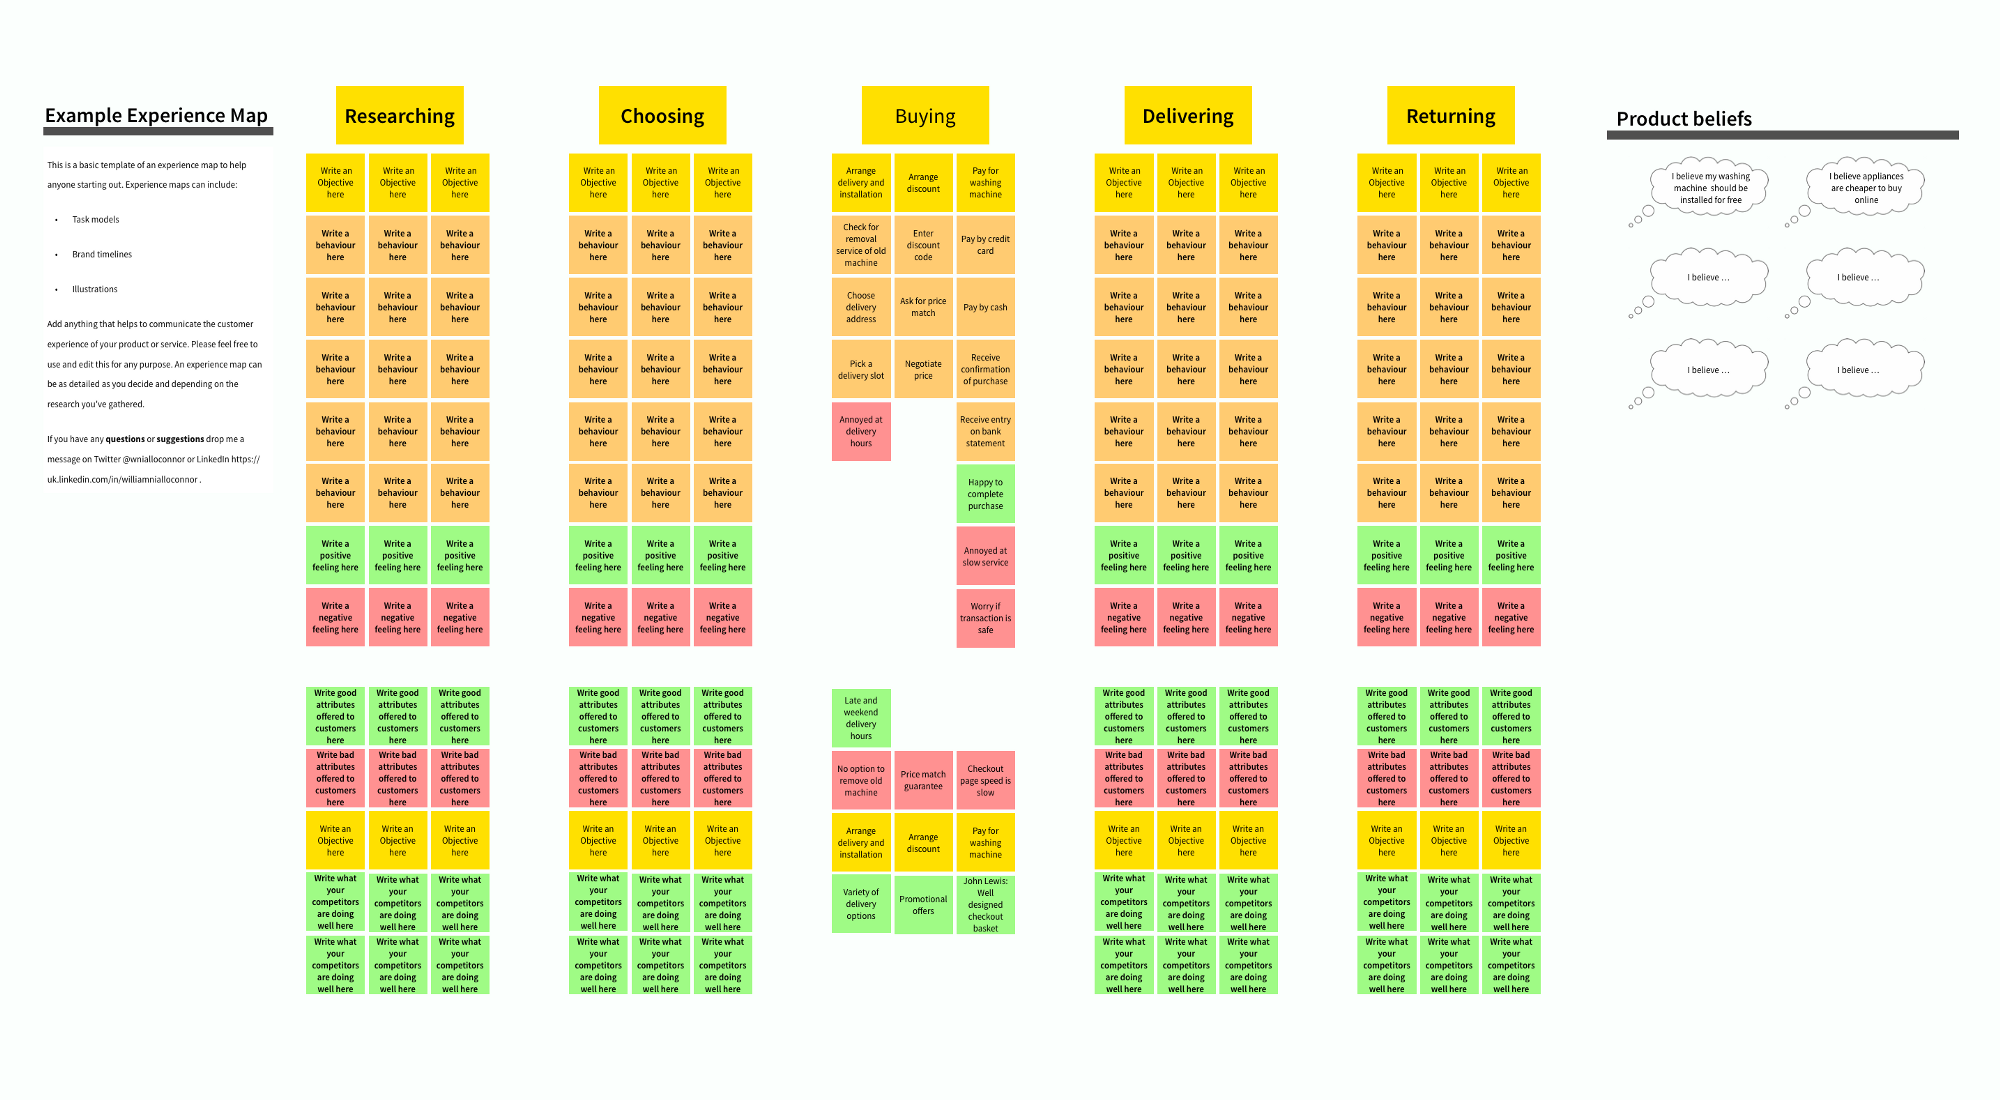
If you would like to build your own experience map you can use an omnigraffle template I created to help you start. You can download it here.
This post was originally published on Niall's Medium profile.